The industry is shifting from individual robots to integrated fleets.
In the modern warehouse, autonomous mobile robots (AMRs) are no longer a novelty. You have Jungheinrich forklifts moving pallets, Kärcher robots cleaning floors, and manual operators navigating the same aisles.
The challenge today isn’t the hardware—it’s the harmony. Most autonomous systems operate using onboard sensors to navigate their immediate surroundings. While they are brilliant at avoiding obstacles, they often lack a “birds-eye view” of the entire floor. For a truly efficient facility, different machines need to do more than just avoid each other; they need to understand each other.
The Seidel GmbH Case: A Symphony of Automation
At Seidel GmbH & Co. KG, the goal was a synchronised, multi-vendor fleet. They didn’t just want automation; they wanted a seamless material flow across hall boundaries.
To achieve this, Seidel implemented an ecosystem where brand boundaries disappear. The orchestration is handled by the NAiSE Traffic Management System, but for that system to work at its peak, it requires a unified, high-precision data stream. It needs to know exactly where every asset is, regardless of brand or type.
This is where Quuppa provides the “Reality Layer.”
The Universal Language of Location in action. See how Quuppa and NAiSE synchronise Jungheinrich and Kärcher fleets at Seidel GmbH.
Bridging the Data Gap
Quuppa acts as the Universal Language of Location. By providing high-precision, real-time location data across the entire facility, we provide the common ground that allows the NAiSE master control to coordinate the entire floor.
The Shared Perspective: While robots use LiDAR for local safety, Quuppa provides the global coordinates. We help the system “see” around corners.
The Interoperability: Because Quuppa is an open platform, it acts as a translator. It turns physical movement into digital data that the orchestration software uses to ensure forklifts and cleaning robots move in sync.
The Efficiency: At Seidel, the Kärcher KIRA B 50 and Jungheinrich EKS 215a don’t just share space; they cooperate. If a forklift is approaching a high-traffic zone, the cleaning robot knows to adjust its path, ensuring the material flow never stops.
The Reality Check: Collaboration is the New Standard
The success at Seidel GmbH proves that the future of the “Smart Factory” isn’t found in a single machine, but in the collaboration between them.
By choosing an open, precise, and scalable location foundation like Quuppa, Seidel has built more than just an automated warehouse. They have created a transparent, predictable environment where data fuels performance. When every asset speaks the same language of location, true orchestration becomes possible.
Is your automation operating in a silo?
The most efficient fleets aren’t the ones with the most robots — they are the ones with the best data. If you are managing a multi-vendor environment and need to bridge the gap between “moving” and “orchestrating,” let’s discuss how the Universal Language of Location can synchronise your operations.
In a recent deep-dive interview with the BluetoothSIG, Quuppa CEO Fabio Belloni stripped away the industrial IoT hype to focus on a single, brutal truth:
Your factory floor is leaking momentum in 5-minute increments.
Most digital transformation projects fail because they are built on guesswork. If your ERP or WMS doesn’t know exactly where an asset is, your workers are forced to search for it. And every minute spent searching is a minute of lost throughput.
Real-World ROI
During the discussion, Fabio highlighted two critical cases where the Quuppa Reality Layer moved the needle on global operations:
At their Tulsa facility, Kloeckner Metals faced a classic industrial bottleneck: a 166,000 sq. ft. environment full of reflective metal where “search and find” was the standard operating procedure. By deploying Quuppa, they didn’t just save time—they unlocked capacity. Load times collapsed from 45 minutes to 7 minutes. This allowed them to ship 3 additional truckloads of steel every single day, adding $15,000 – $20,000 in daily revenue. Most importantly, the system paid for itself in just 4 months.
In a high-velocity terminal environment, efficiency is a game of scale. By providing real-time visibility for 90 workers across three shifts, PostNord reclaimed just 5 minutes of “lost time” per hour, per worker. The result? A 30% increase in total productivity. When you multiply small data gains by a large workforce, the impact on the bottom line is massive.
Beyond the “One-Trick Pony”: Why Ecosystem Scale Wins
Fabio also addressed a common trap in industrial tech: the single-use infrastructure. In the race for niche performance, many companies find themselves locked into proprietary or isolated technologies.
To put it bluntly: Those technologies aren’t necessarily bad; they’re just lonely.
The Quuppa advantage is the power of the Bluetooth® ecosystem. With more than 5 billion Bluetooth devices shipping every year, the scale is incomparable. By choosing Quuppa, you aren’t just buying a tracking system; you are tapping into a global standard that is already in the pockets, on the pallets, and in the vehicles of your entire supply chain.
Quuppa provides the Reality Layer—a scalable foundation that fuels multiple use cases, from safety and logistics to AI-driven process optimisation, all through a single, cost-effective infrastructure. This is how you avoid technical debt while building for the future.
Stop Guessing. Start Seeing.
As Fabio notes in the interview, AI and digital twins are only as good as the data they consume. If that data doesn’t reflect the physical reality of your floor, your automation is flying blind.
Watch the full interview below to see how Quuppa is bridging the gap between the physical world and digital systems.
Time for a Reality Check?
Does your current system reflect the reality of your operations, or are you still searching for answers?
Consult with our experts to identify the “Invisible Leaks” in your facility.
For decades, the logistics and manufacturing industries have operated with a significant visibility gap. High-value assets and personnel have been tracked with precision using active RTLS tags, while high-volume items such as components, parcels, and material bins have remained largely invisible, handled through occasional scans or manual checks.
The barrier has always been economic. The technology to track these items has existed, but the rich feature sets, bulkier form factors, and higher unit costs of traditional tags have made widespread use impractical.
This barrier has now been removed.
A new category: Quuppa Precision Label
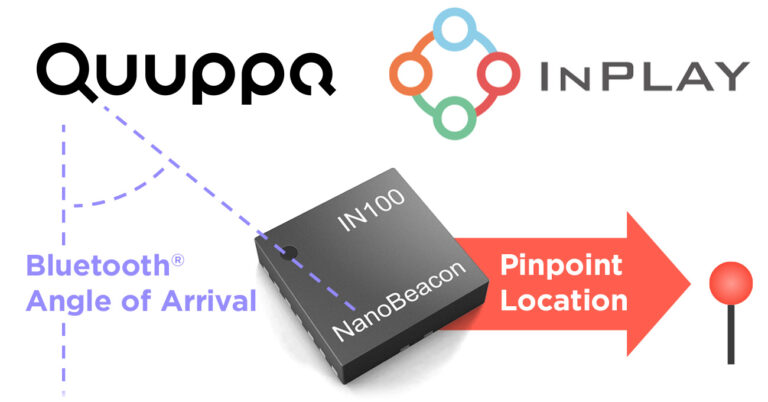
Through a technical collaboration with InPlay and MokoSmart, Quuppa is introducing a new class of device: the Precision Label Tag. By utilising the InPlay IN100 NanoBeacon™ SoC, we have successfully brought Quuppa’s Angle-of-Arrival (AoA) positioning into a form factor as thin and flexible as a standard shipping label.
This is the first time a disposable label-style tag has been tracked with sub-meter accuracy. It makes precise tracking practical for a class of items that has usually remained outside RTLS. We are no longer limited to tracking only the most expensive assets. A much broader share of the physical flow can now be brought into view.
Designed for high-volume flows
The Precision Label Tag is built for high-volume, fast-throughput environments. In these settings, the overhead of collecting and reattaching reusable tags is often too high. A disposable tag removes that burden.
Sustainability has also been a key consideration. The tag uses an eco-friendly, zinc-based paper battery. This makes it thin enough to conform to curved surfaces and light enough to be attached to almost any item without affecting the packaging or the process. Once the item reaches its destination, the tag has fulfilled its purpose.
From checkpoints to continuous visibility
Traditional checkpoint-based identification methods, like RFID, are useful for confirming that an item has passed a specific point in the process. What they do not provide is continuous visibility between those points. If an item is misplaced or a process stalls midway, the system cannot show its location.
Precision Label Tags provide continuous, real-time visibility across the facility. This enables more flexible processes without sacrificing control. Managers can detect bottlenecks earlier, optimise routes in real time, and see whether items are where they should be, with immediate alerts when they are not.
Instead of relying on occasional snapshots, operations gain a continuous stream of actionable data.
One infrastructure, broader visibility
Precision Label Tags operate on the existing Quuppa infrastructure. Premium tags for personnel and high-value assets can run on the same system as label tags used for high-volume items.
This means enterprises no longer have to choose between precision and scale: both can now exist on the same infrastructure.
The trade-off between cost-efficiency and precision is over.
See the Precision Label Tag at LogiMAT
The world premiere of the Precision Label Tag will take place at LogiMAT in Stuttgart, 24–26 March. Visit Quuppa at stand 2C29 in Hall 2 to see sub-meter accurate label tracking in action and discuss how it could fit your operation.
If you are not attending LogiMAT, contact our sales team to learn more about upcoming commercial availability.
Frequently Asked Questions
Precision Label Tags use Quuppa’s Angle-of-Arrival technology to provide sub-meter positioning accuracy when used with Quuppa infrastructure.
The tag is activated by simply peeling it off the backing paper. Once removed, it automatically begins transmitting at the factory-set rate and continues to operate until the battery runs out.
No. Precision Label Tags operate on the standard Quuppa Intelligent Locating System™ infrastructure. Premium tags for personnel and expensive equipment can be used on the same system simultaneously.
The MokoSmart UT1 uses an environmentally friendly zinc-based paper battery and the ultra-low-power InPlay IN100 NanoBeacon™ SoC. Depending on the use case and configuration, battery life can range from days or weeks for real-time tracking of moving objects to several months for slower-moving or stationary items.
To reach the target price point and ultra-thin form factor, the tags are designed as programming-free devices. The transmit rate and power are factory-set and can be customised during manufacturing to match the customer’s application.
Yes. The label tags use a zinc-based paper battery and PVC-free materials, making them a sustainable option for high-volume disposable applications.
Related articles
Quuppa and InPlay Enable Sub-Meter Bluetooth® Positioning With the IN100 NanoBeacon™
Partnership brings enterprise-grade positioning accuracy to cost-efficient, high-volume IoT applications.
Espoo, Finland – March 16, 2026 — Quuppa Oy, a global leader in real-time location systems (RTLS), and InPlay Inc., a pioneer in ultra-low-power wireless SoC technology, have announced compatibility between InPlay’s IN100 NanoBeacon™ and the Quuppa Intelligent Locating System™, both based on Bluetooth® technology.
The collaboration enables a new category of devices: paper-thin and disposable Bluetooth tags that can be positioned with sub-meter accuracy while maintaining ultra-low-power operation and compact form factors.
In high-volume production, unit costs are expected to reach as low as €1–€2, making precise real-time positioning viable for cost-sensitive, high-volume applications such as manufacturing, logistics, and inventory tracking.
Through close technical collaboration, the two companies confirmed that devices built around the IN100 NanoBeacon™ can be positioned using Quuppa’s advanced Angle-of-Arrival (AoA) technology, the same method already used in thousands of enterprise RTLS deployments worldwide.
For InPlay, the collaboration introduces precise and robust positioning capabilities that go beyond traditional RSSI-based or checkpoint-based identification technologies, opening new opportunities across manufacturing, logistics, and inventory tracking.
For Quuppa, the collaboration expands its ecosystem to support ultra-low-cost and disposable tag designs, allowing customers to track both premium tags and low-cost disposable labels on the same infrastructure with consistent, reliable data quality.
“This collaboration demonstrates how open innovation strengthens the Quuppa ecosystem,” said Martti Pinomaa, Chief Sales Officer at Quuppa. “By combining InPlay’s NanoBeacon design with Quuppa’s positioning platform, we’re enabling new use cases where accurate real-time visibility was previously out of reach.”
“Working with Quuppa allows our customers to achieve true Angle-of-Arrival positioning using our cost-effective IN100 NanoBeacon,” said Jason Wu, CEO of InPlay. “It’s an exciting step forward for the RTLS and IoT industries alike.”
Commercial tag designs based on the IN100 NanoBeacon™ are now being developed for high-volume tracking applications, enabling large-scale deployments for asset tracking, logistics, and industrial flow management.
Developers and solution providers can leverage InPlay’s NanoBeacon™ platform to create energy-efficient positioning devices that integrate seamlessly with Quuppa’s infrastructure.
This collaboration signals an important step for the RTLS market: sub-meter positioning accuracy is no longer limited to premium tags. It is now becoming accessible to high-volume, cost-optimised applications across industries.
About Quuppa Quuppa provides enterprise-grade real-time location systems based on advanced Angle-of-Arrival (AoA) technology. Founded in 2012, the company has delivered thousands of installations across manufacturing, logistics, healthcare and defence sectors worldwide.
About InPlay InPlay Inc. designs ultra-low-power, high-performance wireless SoCs for IoT applications, enabling flexible, cost-efficient connectivity at the edge.
The Bluetooth® word mark and logos are registered trademarks owned by Bluetooth SIG, Inc. and any use of such marks by Quuppa is under license. Other trademarks and trade names are those of their respective owners.
Related articles
The Future of Logistics is Thin, Disposable, Cost-Effective, and Pinpoint-Accurate
Digital twins have become a symbol of modern, data-driven operations. They promise optimisation through simulation, precision through models, and control through visibility. They look convincing, behave predictably, and produce outputs that feel objective.
That sense of objectivity is exactly what makes them dangerous when they are built on incomplete or poor-quality data.
Most digital twins do not fail because the models are badly designed. They fail because they create confidence where certainty does not exist. A simulation can be mathematically sound and visually compelling, yet still be detached from what actually happens on the shop floor. When that happens, optimisation does not merely underperform. It quietly pushes decisions in the wrong direction.
When data creates false confidence
There is a fundamental difference between having no data and having bad data. When data is missing, teams know they are making assumptions. Decisions are framed as estimates, uncertainty is explicit, and judgement remains visible.
Bad data removes that awareness. It presents assumptions as facts.
Low-accuracy, high-latency, or inconsistent location data rarely looks obviously wrong in a dashboard or digital twin. It looks precise enough to trust. That trust is what makes it dangerous. Once false facts enter a system, they cascade outward. Layout changes, automation investments, safety policies, and workforce decisions all begin to optimise a reality that does not exist. The more convincing the visualisation, the harder it becomes to question the conclusions behind it.
In optimisation, being confidently wrong is worse than being consciously uncertain.
Why optimisation initiatives stall
Many optimisation initiatives stall at the same point. This is often explained as resistance to change, lack of discipline, or cultural inertia. In reality, a more uncomfortable explanation is frequently closer to the truth: the system cannot see deviation.
On the shop floor, this often surfaces as a simple reaction to new process improvements: “That doesn’t make any sense.” This response is commonly dismissed as emotional or defensive. In practice, it is often reality pushing back against theory.
People resist change when the system asks them to work in ways that feel less rational than before. When improvement initiatives are based on assumptions rather than observation, operators recognise the disconnect immediately. What looks optimal in a model can feel illogical, inefficient, or even counterproductive in practice. This is not a cultural failure. It is a visibility failure.
Clean models, messy operations
Digital twins tend to optimise for a simplified world: shortest paths, ideal flows, perfect timing, and uninterrupted execution. Real operations do not work that way. They are full of detours, delays, micro-decisions, interruptions, and workarounds.
These deviations are not edge cases. They are the system.
When a digital twin cannot see them, it does not eliminate them. It hides them. KPIs remain stable while inefficiencies accumulate underneath. Over time, the gap between what systems believe is happening and what people experience on the floor grows wider, even as dashboards continue to look reassuringly precise.
Why RTLS quality matters more than RTLS presence
At this point, many organisations conclude that they need more data and turn to RTLS. That decision alone is not enough.
Having RTLS is meaningless if the data it produces is not trustworthy. Accuracy, latency, and reliability are not technical details; they determine whether digital twins improve reality or degrade it. Inaccurate or delayed location data does not merely reduce insight. It introduces structural error into every system that depends on it.
In this context, bad RTLS is worse than no RTLS at all. It replaces conscious assumptions with unconscious falsehoods, and those falsehoods quickly become embedded in decisions that are difficult and expensive to reverse.
A different way to interpret resistance
When optimisation efforts fail, the instinct is to blame people, change management, or process discipline. A more honest interpretation is often simpler. If the system cannot see how work actually happens, it cannot improve it. If the digital view drifts away from physical reality while still appearing precise, optimisation becomes theatre.
Digital twins are not the problem. RTLS is not the solution by default.
The real question is whether the digital view is continuously anchored in what actually happens, or whether it is slowly drifting away while retaining the appearance of certainty. That distinction determines whether optimisation leads to meaningful improvement or to increasingly confident mistakes.
Is your data ready for optimisation?
If your digital twin looks convincing but you are not sure it reflects reality, it’s time to examine the data that underlies it.
Let’s take a closer look at the quality of your real-time visibility.
A dot on the map is the first goal for any Real-Time Locating System (RTLS). Seeing where assets or people are located confirms that the system works and that physical operations can be observed digitally. In many deployments, this is also where progress slows.
The issue is not data quality or quantity. Modern RTLS platforms produce accurate, high-frequency location updates with ease. The challenge arises when this data needs to support decisions, actions, or improvement in connected systems. Visibility alone does not create value unless it is translated into something operationally meaningful.
This is fundamentally an integration problem.
From location data to operational signals
Most downstream systems do not need continuous coordinates. They need signals that reflect changes in state:
Asset entered or exited an area
Movement stopped or resumed
Process step was completed
Exception occurred
These moments are when actions are taken or insights are formed.
When raw location data is forwarded without structure or intent, interpretation is pushed downstream into middleware or application logic. Over time, this leads to noisy data flows, fragile integrations, and systems that are difficult to scale.
The core challenge is aligning how data is produced with how operations actually function.
Event-driven integration as a design principle
Event-driven integration addresses this by focusing on change rather than constant updates. Instead of asking “where is everything now?”, systems react to “what just happened that matters?”.
Events, states, and transitions map naturally to operational logic. Designing integration around them reduces unnecessary data transfer and makes downstream behaviour more predictable. This is not a single feature, but a design principle that shapes how data leaves the system.
In the Quuppa Positioning Engine, this principle is implemented through mechanisms that allow relevance to be defined at the source.
Event-Driven Data Integration in the Quuppa Positioning Engine
At the centre of this approach is the concept of Output Targets. An Output Target defines a purpose-specific data stream by specifying
What data is observed
When output is triggered
How data is packaged
Where it is delivered
Multiple Output Targets can run in parallel, each serving a different use case. One may deliver immediate operational events, while another collects aggregated data for analysis or reporting. The same underlying location data supports both, without forcing them into a single integration pattern.
This allows integrations to be designed around actual needs rather than adapting every use case to a generic output.
Controlling when and what data is sent
The first dimension of control is timing. Output Targets support both interval-based and change-based triggering. Interval-based triggers provide regular snapshots when needed. Change-based triggers produce output only when something meaningful has changed.
By combining these, integrations can be designed to emit events instead of repeated updates, avoiding unnecessary processing in receiving systems.
The second dimension of control is content. Filtering allows Output Targets to be limited to specific conditions, such as zone changes, significant movement, or tag actions. Filtering is applied inside the Positioning Engine before data leaves the system.
This reduces data volume and moves integration logic closer to the source, where it can be applied consistently. Instead of duplicating filtering rules across multiple downstream systems, relevance is defined once and reused.
Controlling how data is delivered
Not all use cases require immediate delivery of individual events. For analytics and reporting, it is often more efficient to collect events over time and deliver them in batches.
Output Targets support configurable batching and send intervals, allowing integrators to balance timeliness and efficiency. Immediate events can be delivered as they occur, while other data can be aggregated and sent at predictable intervals. This reduces network traffic and lowers the load on receiving systems, especially in larger deployments.
The same integration model supports both real-time actions and deferred analysis through configuration, not additional tooling.
Designed to scale
In small deployments, ad-hoc integrations can be sufficient. As systems grow, poorly structured data flows become a limiting factor. Excessive data volumes, fragile middleware, and tightly coupled integrations all increase operational cost.
By providing fine-grained control over when, what, and how data is delivered, the Quuppa Positioning Engine enables integrations that remain manageable as deployments expand. Event-driven design reduces noise, filtering simplifies logic, and batching improves efficiency.
From dots to decisions
Seeing where things are is a necessary starting point for any location-based system. Turning that visibility into decisions is what creates lasting value.
Event-Driven Data Integration is how the Quuppa Positioning Engine supports this transition. By allowing relevance to be defined at the source and data flows to be tailored to specific use cases, the platform helps customers move beyond raw signals toward systems that are easier to operate, integrate, and scale.
What matters in the end is the outcome: location data structured to support decisions, not just display the dots on a map.
Solution looking for a problem?
Over the years, we’ve seen many RTLS deployments succeed technically but stall operationally. Most often, the reason is not the system itself, but that the right question was never asked, or never quite found. A classic case of a solution looking for a problem. Data looking for meaning.
We work with customers and partners to:
clarify the operational questions that actually matter
translate those questions into events, states, and signals
configure the Quuppa Positioning Engine to deliver the right data, at the right time, in the right form
If you are exploring how to make better use of your location data, or want to sanity-check an existing setup, we’re happy to share our experience.
If you want to go deeper into the technical details behind Event-Driven Data Integration in the Quuppa Positioning Engine, the following resources may be useful:
In any advanced technology platform, the Application Programming Interface (API) is the critical conduit through which raw capability is transformed into tangible results. For a Real-Time Locating System (RTLS) such as the Quuppa Positioning Engine (QPE), the API is even more fundamental: it determines whether the system delivers a “firehose” of raw data or a refined stream of operational truth. A seductive dot moving on a map is not the end goal; the true objective is a trustworthy digital representation of physical operations—what we call the Reality Layer.
This white paper provides an in-depth analysis of the QPE API’s evolution through its major releases, tracing its development from a provider of location coordinates to a sophisticated, event-driven integration framework. This journey reveals more than technical enhancements; it reflects the platform’s strategic maturation, designed to empower developers and system integrators.
The core thesis of this paper is that the API’s evolution is the story of Quuppa building the tools necessary to create this trustworthy Reality Layer. By systematically adding layers of control—over data format, delivery cadence, filtering, and transformation—Quuppa has shifted the integration paradigm from consuming raw signals to defining operational truth directly at the source. This paper will examine the key eras of this evolution, beginning with the foundational architectural shift introduced in version 7.0.
A Foundational Shift: The Birth of the Modern Data API in QPE 7.0
The release of QPE version 7.0.0 in February 2021 marked a watershed moment for the platform’s data integration capabilities. This version introduced a fundamental paradigm shift, moving away from a set of rigid, predefined data endpoints toward a flexible, developer-defined data access model. It was the first major step in empowering integrators to request the exact data they needed, in the format they required.
Strategically, the most significant change was the deprecation of the legacy getTagPosition and getTagInformation API commands. This move signalled the end of a “one-size-fits-all” approach to data retrieval, where developers were forced to make separate calls for different types of tag data and handle the outputs as-is.
In their place, Quuppa introduced the unified getTagData API command. The power of this new command came from its accompanying markup language, which for the first time allowed developers to define the precise structure and content of the API response. Whether the downstream application required a lean set of coordinates in CSV format or a rich JSON object with detailed tag information, getTagData could be configured to provide it in a single, efficient call.
This new data access model was complemented by a new suite of API commands for managing persistent data streams: listOutputTargets, createOutputTarget, and controlOutputTarget. Collectively, these commands provided the foundational tools for creating, managing, and controlling purpose-built data streams directly from the QPE, laying the groundwork for more advanced event-driven architectures.
The contrast between the old and new models highlights the significance of this release.
Pre-7.0 API Model
Post-7.0 API Model
Separate, rigid commands for position (getTagPosition) and info (getTagInfo).
A single, unified getTagData command for all tag-related data.
Fixed, predefined response formats for each command.
Fully configurable response format using a markup language, supporting both JSON and CSV.
Lacked native, API-driven tools for managing persistent data streams.
A comprehensive suite of commands for creating and controlling Output Targets, with support for persistent configurations.
Architectural Burden: Data fusion and schema mapping handled in client application or middleware, increasing code complexity.
Architectural Benefit: Data fusion and formatting are handled at the source by the QPE, simplifying integration logic and reducing network overhead.
This new foundation of a unified data command and programmatic stream management set the stage for subsequent enhancements that would provide even more granular control over the data flow.
Refining the Flow: Batching, Triggers, and Protocol Expansion (Versions 7.x – 9.3)
Following the major architectural changes in version 7.0, subsequent releases focused on refining the data delivery mechanisms. This phase of the API’s evolution can be characterised as a concerted effort to “tame the firehose,” giving integrators powerful new tools to manage data volume, cadence, and transport protocols. It marked the moment the API realised a crucial insight: Events are reality, not coordinates.
This period saw a critical evolution in data triggering mechanisms. Version 9.3.1 (June 23rd 2025) refactored the trigger modes for output targets and, most importantly, introduced the onDataChange parameter. This addition was pivotal, enabling true event-driven workflows. Instead of sending data at a fixed interval, developers can configure the QPE to send an update only when a specific, meaningful change occurs. This is where the QPE began to speak the language of business operations (an asset entered a zone, a button was pressed) rather than just the language of physics (its coordinates are X, Y, Z). This prevents redundant data transmission and ensures that downstream systems respond only to new information.
A key enhancement for managing data volume was introduced with message batching in version 9.3.1. The maxBatchSize parameter allowed developers to configure an output target to collect multiple tag events into a single message before sending it. The impact of this feature is significant for large-scale systems, as it directly reduces network traffic, minimises the frequency of database writes, and lowers the overall processing load on receiving applications.
The platform’s integration capabilities were further broadened with the introduction of the MQTT Publisher in version 8.5.2 (September 2023). By adding native MQTT support, a lightweight, ubiquitous IoT messaging protocol, Quuppa dramatically simplified integration. For an architect, this is a critical distinction: it enables the QPE to become a first-class citizen in modern IoT architectures, publishing events directly to enterprise message brokers or cloud IoT platforms, such as AWS IoT Core or Azure IoT Hub, without requiring an intermediate polling service or a custom protocol bridge.
In summary, this evolutionary phase marked the maturation of the QPE API from a flexible data source into an intelligent data gateway, paving the way for the next level of in-engine data manipulation.
The Apex of Control: In-Engine Filtering and Transformation in QPE 9.5
The release of QPE 9.5.1 on December 19th 2025, represents a significant step in the platform’s move toward source-side data control, significantly advancing the philosophy of designing relevance at the source. While previous versions allowed developers to manage data timing and batching, this release added a new level of granularity: the ability to precisely filter and reshape data before it leaves the engine.
The introduction of the 'filter by' parameter for output targets had a profound impact on integration architecture. This feature allows predefined filtering criteria—such as zone change events, location updates, or button presses—to be applied directly to a data stream within the QPE. The benefit for developers is immediate and substantial: filtering logic that would previously have been written, tested, and maintained in middleware or the end application can now be handled natively by the engine. This not only reduces integration code complexity but also ensures that filtering rules are applied consistently at the source.
Complementing this was the addition of the 'send interval' parameter. When combined with the previously introduced batching capabilities, this feature provides deterministic control over data delivery cadence. For analytics platforms or reporting systems that require predictable data ingestion intervals, this allows the QPE to collect relevant events over a defined period and deliver them in a single, batched message at a reliable cadence.
Finally, version 9.5.1 introduced new data transformation options that further reduce the need for data wrangling in downstream applications:
• Date Formatting: The .iso and .isoutc options automatically convert timestamps to the standard ISO 8601 format.
• Key Renaming: The .as. option provides a simple mechanism for renaming JSON keys in the output. For example, $(tag.name.as.Name) could remap a standard field "tagName": "MyTagName" to a custom schema "Name": "MyTagName".
These seemingly small features have a significant practical value, as they offload common data mapping and schema alignment tasks from the integration layer into the QPE itself. The capabilities in 9.5.1 represent the most advanced expression of the “control” philosophy, providing a comprehensive toolkit for designing highly specific and efficient data streams.
Broadening the Scope: Evolving APIs for System and Tag Management
A mature platform API must provide programmatic control not only over data output but also over the entire system’s configuration and operational state. In parallel with the evolution of its data streaming capabilities, the QPE API expanded to offer comprehensive commands for managing locators, tags, and the positioning engine itself, enabling deeper automation and more dynamic system control.
The APIs for locator and engine management followed a similar evolutionary path toward greater flexibility. In version 9.5.1, the legacy Get Locator information and Get Positioning Engine information commands were officially deprecated. They were replaced by the more capable Get Locator data and Get PE data commands, introduced in version 9.3.1. Much like the getTagData command, these new methods allowed developers to use custom output formats, providing tailored access to system and infrastructure state. This era also saw the addition of other key management commands in version 9.5.1, such as connectToQCP for dynamically controlling the connection to the Quuppa Customer Portal and enhancements to setLocatorIP, further cementing the API’s role in infrastructure management.
Tag management saw significant advancements, particularly with the introduction of support for the Quuppa V3 Protocol in version 8.0.0 (Jan 24th 2023). With V3 Protocol tags, the QPE automatically handles configuration based on tag group settings, significantly reducing the need for manual or API-driven configuration. For large-scale deployments with hundreds or thousands of tags, this feature dramatically reduces manual configuration effort, minimises human error, and ensures that all tags within a specific group operate with a consistent and correct configuration.
These enhancements demonstrate the API’s growth into a comprehensive system management interface. By exposing deep control over hardware, software, and tag behaviour, the API enables the automation of deployment, configuration, and maintenance tasks, empowering users to manage the entire Quuppa ecosystem more efficiently.
Conclusion: The API as a Reflection of Platform Strategy
The evolution of the Quuppa Positioning Engine API is a compelling narrative of strategic focus. It chronicles a journey from a simple interface for pulling coordinates to a sophisticated, event-driven framework that provides deep control over data filtering, formatting, and delivery. This progression—from the foundational getTagData command, through event-based triggers, to in-engine transformation—is not merely an accumulation of features. It is the deliberate construction of the tools needed to turn raw signals into operational truth.
This technical evolution is a direct reflection of Quuppa’s broader strategy: a shift from being a technology provider to a solution enabler. The API provides the essential tools for developers to build the Reality Layer—a trustworthy, real-time digital representation of what is actually happening in a physical space, not what was supposed to happen. By empowering integrators to define relevance at the source, the API ensures this layer delivers actionable signals that enable customers to both operate with immediate, accurate decisions and optimise by learning from aggregated historical data.
For developers and system integrators, the ultimate value proposition of the modern QPE API is clear and multifaceted:
Reduced Integration Complexity: By handling filtering, batching, and data transformation at the source, the API minimises the amount of custom code required in downstream applications and middleware.
Improved System Performance: By enabling event-driven, purpose-built data streams, the API reduces unnecessary network traffic and lowers processing load on receiving enterprise systems.
Faster Time-to-Value: By providing tools to translate raw location updates into meaningful business events directly within the QPE, the API enables rapid workflow development that delivers actionable insights, not just a seductive dot on a map.
As the primary interface to the Quuppa ecosystem, the API’s history demonstrates a clear commitment to empowering developers. It remains the critical enabler of control and innovation, ensuring the platform continues to deliver not just data, but a foundation for operational excellence.
Access control that works without gates, badges, or bottlenecks
The Olympic Experience
You arrive at the Olympic Village. The architecture is open and modern, defined by glass, light, and wide entrances. Some people move in larger groups. There are no visible checkpoints, no queues of people waiting to be processed, and no sense of being funnelled through security.
You walk towards the entrance with others, and the doors open. Your access was permitted without you noticing anything, which is exactly the intent.
Behind the scenes, access control is working continuously, but it is not experienced as control. There are no badges to show, no gates, no tags to collect, no physical tokens to remember. The system does not interrupt the flow of people.
The central challenge of this environment is to achieve these two seemingly contradictory goals simultaneously: World-class security for a global event, and an open, welcoming space where movement feels natural.
Crowd density is what makes this even more challenging. At peak moments, large groups of people arrive at the same time. This is where traditional access control systems struggle. Manual checks do not scale. Video can see people, but it cannot decide who is allowed to enter, and biometric identification is neither practical nor acceptable.
Yet access decisions still have to be made instantly, reliably, and without friction.
The invisible layer that makes access possible
The Milani Freeway access control system at the Olympic Village uses Quuppa’s real-time location data as an invisible decision layer.
Every authorised user carries a smartphone. As an alternative to distributing physical access tags, an application on the phone transmits a defined Bluetooth signal that emulates a tag. Quuppa’s Angle-of-Arrival technology locates these signals accurately and reliably in real time.
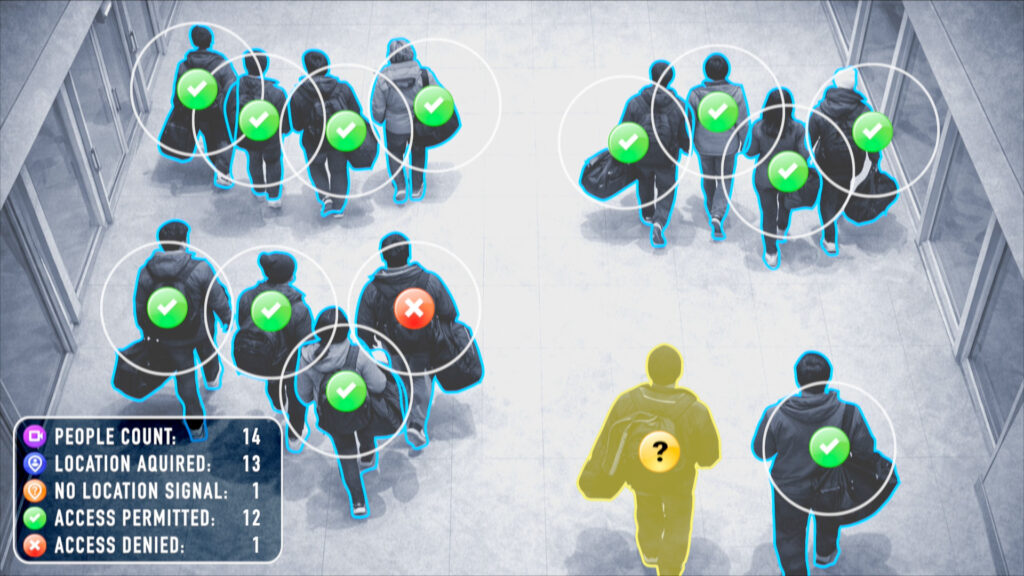
As groups approach an entrance, video and AI systems observe the number of people present and monitor for tailgating behaviour. Quuppa provides real-time confirmation of access permissions for each person. Milani’s Freeway Access Control logic compares these two realities. If the numbers and locations match, access is granted. If they do not, the system shows which individual is not allowed to enter, and security personnel will handle the situation.
Video confirms presence. Location confirms permission.
Without this location-based permission layer, video alone would only confirm that people are present. It would not be able to decide whether access should be allowed. In dense crowds, accurate location is used to determine who is allowed to enter. The flow of people is not interrupted; only the person without permission will be stopped. Security remains invisible, and the system intervenes only when necessary.
Privacy without compromise
The Freeway solution is designed to operate within strict privacy constraints. No biometric data is used. The system does not identify people; it validates access permissions in real time.
This approach makes it suitable for a high-profile international event where public trust, regulatory compliance, and operational reliability all matter equally.
After the Games
When the Olympic and Paralympic Games end, the Village does not disappear. It becomes student housing.
The context changes, but the need for reliable access control does not. The same buildings remain in use. The Freeway system remains in place. What changes is the rhythm of life.
Crowds are smaller and more predictable. Access patterns are everyday rather than exceptional: guest access, residential rules, and long-term continuity become more important than peak throughput. The access control logic adapts, but the foundation stays the same.
What was designed to function under the most extreme conditions now supports daily life. Security no longer has to scale for Olympic surges, but it still has to be trustworthy, unobtrusive, and easy to live with.
This continuity is key. Infrastructure built for a global event is not dismantled when the spotlight fades. It becomes part of the city and everyday life.
Access control as a data problem
Access control is often treated as a hardware problem: doors, locks, cameras, credentials. Fundamentally, it’s a data problem.
In environments where people move in groups and density fluctuates rapidly, systems need a reliable reality layer that reflects what is actually happening in the physical world.
The Milani Freeway solution shows how real-time location data can provide that layer. It enables access control that works under extreme crowd pressure and continues to function quietly in everyday environments.
The result is security that remains invisible when everything is normal, and decisive only when it is not.
Engineering invisible access at Olympic scale
Milani is an engineering and systems integrator with decades of experience delivering complex electrical, automation, and IoT solutions for large-scale, security-critical environments.
Freeway is Milani’s access control platform, designed to manage high-volume, barrier-free access while meeting strict requirements for reliability, cybersecurity, and GDPR compliance.
Quuppa provides the real-time location component within the Freeway system, supplying accurate location data that allows the platform to associate physical movement with digital access rights.
By combining video-based people counting with precise location data, Freeway enables access control decisions to be made in real time, without slowing people down and without relying on biometric identification.
The result is an access control system capable of operating at Olympic scale, and flexible enough to remain in use long after the Games are over.
In any complex industrial operation, there’s a universal frustration: you have a perfect plan, a sophisticated ERP system, and a detailed schedule, yet reality on the shop floor is always messier. The real breakthroughs we’ve seen don’t come from theory; they come from being there, on the floor, watching how things actually happen. These insights stem from our lived experience: what we’ve seen, measured, and learned from real-world operations.
Tiny Deviations Create the Biggest Disruptions
The most significant disruptions in industrial processes don’t typically stem from major strategic flaws or catastrophic equipment failures. Instead, they are the result of the cumulative effect of small, everyday human actions. A single misplaced tool or material carrier, a momentary distraction, or a slight deviation from a rule can create massive ripple effects of “search effort” and downstream delays.
Everything in our process is defined, but people are all different and that makes all the difference… That’s just human.
These seemingly minor events are incredibly costly. In some large manufacturing facilities, workers can walk up to 10 kilometres per day just searching for materials and tools. Even in highly regulated aerospace environments, an estimated 90% of an aircraft is hand-built, making the human factor a constant variable. This search effort is pure “non-added value,” one of the most expensive hidden costs in any operation. What makes this surprising is the contrast: companies spend millions on advanced machinery and sophisticated planning software, assuming the problems are complex. Yet the most persistent challenge is rooted in simple, repetitive human behaviour.
Your Dashboards Are Lying to You
There is a critical and often invisible gap between the data in planning systems and the physical reality on the shop floor. The irony is that the very systems designed to provide clarity are often actively creating a false one. While your dashboards and KPIs may show that everything is “green” and on schedule, the actual situation can be chaotic, undermining critical metrics like On Time In Full (OTIF).
You get what you measure, and if success means keeping the dashboard green, people will always find a way to make it glow.
This discrepancy happens because workers, often measured against strict delivery times, may “cheat” the system to meet a target. A forklift driver might scan a barcode for a delivery point while still en route, or an operator might sign off on a work order before the task is physically complete. This creates a fundamentally unreliable data foundation. Managers who then make critical operational decisions based on this inaccurate data are led to believe everything is fine, forcing them to fight fires reactively when the truth eventually surfaces.
The problem is not the system but the input.
The conventional wisdom for fixing systemic failure is a full-scale replacement of enterprise systems. The reality is that the most powerful fix isn’t a new system, but a “Reality Layer” that makes your old one finally work as intended. This real-time view of where assets, tools, and materials are actually located at any given moment is the most effective solution for addressing deep-seated inefficiencies.
After we started feeding real-time data from Quuppa to our ERP, the numbers got worse! Which was perfect, because it started to reflect reality, which is never perfect.
This real-time visibility serves as the crucial connection between the physical world and digital systems, closing the “visibility gap” that causes numerous problems. Rather than replacing expensive platforms, this approach augments them with the reliable, ground-truth data they need to function as intended. This is a powerful strategy because it is less disruptive and allows companies to finally realise the value they were promised from their existing ERP, WMS, and MES investments by providing them with accurate, real-time information. Quuppa is the bridge between the physical world and digital systems.
Customers Arrive with One Problem, but Discover More ROI Elsewhere
A common refrain we hear from customers is, “We were solving bottlenecks. We didn’t expect to cut downtime by 43% too.” This captures a universal truth about adopting real-time location systems (RTLS): companies typically invest to solve one well-defined pain point with a couple of other use cases, but the actual, long-term ROI emerges from discovering and solving problems they didn’t even know they had.
Admittedly, Quuppa has revealed things we always had a hunch about but didn’t want to face. Now that they’re visible, we can’t pretend anymore. We have to act.
The pattern is consistent: One customer came to solve a bottleneck in their surface treatment process but discovered the most significant win was automating SAP bookings for defective batches. Another adopted the system to manage material carriers but found unexpected ROI by automating program loading for their CNC machines, eliminating manual errors entirely. This evolution from a single-problem tool to a strategic platform is where the true value emerges. This makes the investment “future-proof,” turning a tactical tool into a strategic platform for continuous improvement.
The “Aha!” Moment Comes from a Simple Dot on a Map
While advanced RTLS technology offers many powerful features—like event triggers, process flow analysis, and historical heat maps—the most immediate and profound value for most customers comes from a very simple function: seeing a reliable “dot on the map.”
I just want to see if my assets are there. There’s the dot on the map. Great. I’m happy.
In a complex, dynamic industrial environment, the absolute certainty of knowing exactly where assets are in real-time eliminates the enormous cost and cognitive load of searching. This simple function provides the ground truth. It is the foundation upon which all other optimisations are built. It allows workers to stop searching and start doing, and it gives managers the confidence to make decisions based on what is, not what their system hopes is true.
Time For a Reality Check?
The pattern is familiar across industries: the most significant operational improvements come not from more complex plans or more sophisticated software, but from gaining a simple, clear, and honest view of what is actually happening – The Reality Layer.
To find out where your own visibility gaps might be, let’s start with a quick Reality Check.
Modern aviation manufacturing and Maintenance, Repair, and Overhaul (MRO) operate on a scale of almost unimaginable complexity. An aircraft like the A350, for instance, is assembled from approximately 2 million individual parts, each requiring meticulous documentation, certification, and coordination. This environment demands absolute precision, yet even the most detailed plans collide with the unpredictable reality of the shop floor, threatening both process integrity and schedule reliability.
TL;DR? Download summary PDF – key points at a glance.
Despite sophisticated Enterprise Resource Planning (ERP) systems, persistent “blind spots” create a fundamental gap between the planned process and the actual situation. This data-reality gap is driven largely by the unpredictable “human factor”—the natural tendency for people to deviate, adapt, or make mistakes. The result is wasted time, costly delays, and a constant state of reactive problem-solving.
The strategic imperative for aviation leaders is clear: they must close the gap between plan and reality. Real-Time Location Systems (RTLS) provide the foundational data layer to manage this complexity, transforming operations from reactive firefighting to proactive, data-driven optimization. To understand the power of this solution, one must first appreciate the depth of the challenges it is designed to solve.
The Anatomy of Inefficiency: Unseen Friction in Aviation Operations
In the high-stakes environment of aviation, the strategic importance of understanding operational friction lies in its cumulative cost. Seemingly small, everyday issues can escalate into significant delays, compliance risks, and financial losses. These inefficiencies are often invisible to traditional management systems, yet their impact is felt across the entire value chain, culminating in expensive outcomes like “traveled work”—work that must be completed out of sequence at a different facility due to preventable delays.
The High Cost of the Search Effort
One of the most pervasive sources of non-added-value work is the time workers spend searching for misplaced tools, materials, and parts. This search effort is a direct, physical manifestation of the data-reality gap. On vast shop floors, workers can walk up to 10 kilometers per day in search of necessary items, a staggering figure that translates directly into wasted time, extended production cycles, and increased labor costs. This represents a persistent and expensive pain point across nearly every segment of the industry.
The Data-Reality Gap
A critical disconnect exists between the status reported in ERP systems and the actual situation on the shop floor. For instance, a forklift driver might scan a barcode for a delivery station while still in transit to satisfy a KPI, marking a task as complete in the system before the physical work is done. This practice of “cheating” the system masks underlying problems and forces shift managers and leadership to make decisions based on flawed data. When the digital record and physical reality diverge, process integrity breaks down, leading to flawed planning and constant disruptions.
The Human Factor: The Unplannable Variable
At the root of this operational unpredictability lies the “human factor.” People, by their nature, deviate from instructions, adapt processes on the fly, and make mistakes. This constant, dynamic interaction creates what is known as an “NP-hard problem”—a level of complexity that cannot be fully solved by top-down planning or mathematical algorithms alone. While traditional systems like ERPs strive for a perfectly planned state, they cannot account for the irreducible variance introduced by human action. Perfect planning may be mathematically impossible, but managing the resulting variance is not.
Overcoming these deep-seated, human-driven challenges requires a new layer of intelligence that bridges the physical and digital worlds.
The Quuppa Solution: From Raw Data to Actionable Insight
Addressing the deep-seated challenges of operational friction requires a strategic philosophy anchored by a simple truth: “You can’t fix what you can’t see.” Quuppa’s Real-Time Location System is designed to deliver this essential visibility. By providing an accurate, live, and comprehensive view of physical operations, Quuppa makes the invisible frictions of the shop floor visible and, therefore, manageable, closing the data-reality gap with a foundational data layer that translates raw location information into actionable business intelligence.
Quuppa’s RTLS delivers three core, interconnected values to the aviation industry:
Real-Time Visibility: This is the foundational “dot on the map” capability, providing an accurate, live view of all tagged assets—from certified tools and critical parts to material trolleys. This eliminates the search effort, giving workers and managers immediate knowledge of where everything is.
Historical Process Intelligence: The value of RTLS extends far beyond live tracking. By recording these “dots” over time, we unlock Historical Process Intelligence. Recorded location data enables the creation of heat maps that reveal bottlenecks and spaghetti diagrams that show actual material and tooling flows. This turns a live view into a data-backed blueprint for optimization.
Automation and Integration: This verified data can then be integrated with enterprise systems (ERP, WMS, MES), enabling event-driven Automation that aligns digital workflows with physical reality. For example, a tagged material trolley entering a geofenced area can automatically trigger a booking in the ERP system or a request for material replenishment, reducing manual input errors and improving data accuracy.
The true value of this technology is best understood through its practical application in real-world scenarios.
Case Studies in Transformation: RTLS in Action Across the Aviation Sector
Examining real-world deployments provides concrete proof of how RTLS moves beyond theory to deliver measurable operational and financial improvements for industry leaders. These cases demonstrate how a foundational layer of visibility can solve distinct, high-stakes problems across manufacturing and MRO by closing each organization’s unique version of the data-reality gap.
Airbus: A Strategic Approach to Solving Core Logistical Pain Points
Airbus began researching real-time location solutions in 2017 to address a critical need: identifying materials and bridging the visibility gap within its vast logistics stream. Officially adopted in 2019, the Quuppa system was implemented to tackle extensive search efforts and the misplacement of parts. A key technical advantage was Quuppa’s use of a proprietary channel, which allowed it to operate effectively in industrial environments where standard Bluetooth was often restricted. By providing an accurate, real-time view of assets, Airbus could ensure the right parts were in the right place at the right time, advancing its “factory of the future” vision.
Safran Aircraft Engines: Eliminating Expensive Delays in MRO
In a massive deployment, Safran Aircraft Engines implemented RTLS to track over 30,000 tools across two facilities totaling over 75,000 square meters. The primary objective was to eliminate the expensive operational delays caused by missing tools—a common but costly problem in MRO environments. The system provides instant location information for every critical tool, drastically reducing search time. Beyond preventing delays, the system also enables proactive monitoring of all tools, allowing Safran to schedule preventive maintenance and ensure every asset remains in optimal condition.
Fokker Services Group: Driving Automation and Paperless Operations
Fokker Services Group adopted RTLS with several strategic goals in mind: to automate material flow in its MRO operations, achieve a fully paperless shop floor, and improve a critical industry metric—OEM On-Time-Deliveries. The system’s ability to provide real-time visibility into assets and processes via dynamic dashboards enables faster problem detection and proactive adjustments. This creates a direct link between the operational reality on the shop floor and key performance metrics, allowing areas for improvement to be identified and addressed immediately.
While these individual successes are compelling, the true strategic power of RTLS emerges when these operational gains are aggregated and translated into quantifiable business impact across the enterprise.
The Tangible ROI: Quantifying the Value of Visibility
While individual case studies are powerful, the true strategic value of RTLS is realized when its benefits are aggregated and analyzed across key business functions. This technology translates directly into measurable improvements in operational efficiency, process automation, decision-making, and compliance, delivering a clear and compelling return on investment by closing the gap between data and reality.
Translating Visibility into Value
Benefit Category
Specific Improvement
Business Impact
Operational Efficiency
Drastically reduced search time for tools and materials.
Increased worker productivity, reduced production cycle time, and minimized non-added-value labor costs.
Process Automation
Automated ERP bookings for process steps, defective batches, and material replenishment.
Reduced manual input errors, improved data accuracy, and freed up human resources for higher-value tasks.
Enhanced Decision-Making
Provided managers with a real-time, accurate view of shop-floor status, closing the data-reality gap.
Enabled faster and more effective responses to disruptions, improving adherence to production schedules and enhancing overall operational control.
Compliance & Traceability
Ensured meticulous, real-time tracking of every certified tool and component throughout the MRO and manufacturing process.
Strengthened audit readiness, ensured adherence to strict airworthiness regulations, and future-proofs the operation against evolving regulatory landscapes.
These quantifiable benefits make a clear business case for RTLS not merely as a tactical tool, but as a strategic investment for the future of aviation operations.
The Future of Aviation is Visible
The aviation industry’s immense complexity, coupled with the inherent unpredictability of the “human factor,” can only be mastered with an accurate, real-time view of physical operations. Quuppa is the bridge between the physical world and digital systems, providing the foundational real-time data layer that makes this essential visibility possible. As our brand promise states: “Quuppa helps our customers see what they’ve been missing.”
In an era of accelerating digital transformation, where technologies like AI promise to revolutionize industry, real-time visibility is no longer just an operational advantage. It is a strategic prerequisite. High-quality location data is the fuel for intelligent automation, predictive analytics, and process excellence. It is the foundation upon which future innovations will be built.
For the aviation leaders of tomorrow, real-time visibility is not merely an operational tool—it is the foundational prerequisite for competitive dominance.
Let’s talk.
Flying your process blindfolded and relying on gut feeling eventually makes your gut hurt.
Replacing guesswork with real-time visibility brings confidence and predictability, and helps you navigate through turbulence (and sleep better).
Let’s get together and put the pieces together.
This form is the fastest way to reach the right expert. Please provide a few details to help us route your message and prepare a meaningful reply.
Case Study: A Hybrid Tracking Solution for Automotive Manufacturing Efficiency
An automotive manufacturer faced challenges tracking large, identical semi-finished vehicles spread across vast indoor and outdoor areas. Manual efforts failed, causing delays. Bit Tonic implemented Quuppa’s RTLS with AoA technology, enabling seamless, automated tracking—boosting efficiency and eliminating costly setbacks.
Background
A company in the automotive sector manufactures very large vehicles in high volumes. During the early stages of production, these semi-finished vehicles are indistinguishable from one another. Due to the nature of the production process, these items are temporarily stored—often without proper tracking—in areas that can be hundreds of meters away from where they are eventually needed.
Challenge
The semi-finished products are stored both indoors and outdoors, making the use of GPS technologies unfeasible. An initial attempt to track items by assigning the responsibility to forklift drivers failed due to the excessive manual effort required to collect accurate location data. When an item went untracked, it would effectively exit the production process and only reappear once it was eventually identified—sometimes weeks later. This led to cascading delays and made it difficult to monitor production. The search process often involved covering large areas by bicycle or forklift.
Solution
To overcome these challenges, our solution partner Bit Tonicimplemented a Quuppa solution—equivalent to AccuRTLS—using AoA (Angle-of-Arrival) technology. This cutting-edge solution enables real-time tracking with location accuracy down to a few tens of centimeters in real-world industrial environments.
Each semi-finished product was fitted with a BlueUp Forte+ tag compatible with Quuppa’s infrastructure, enabling traditional indoor tracking via ceiling-mounted antennas. For the expansive outdoor areas—spanning several square kilometers—a fully autonomous drone system was developed. The drone is capable of autonomous take-off, landing, and navigation along predefined flight paths covering typical storage zones. Equipped with an AoA antenna, it can locate tagged items with one-meter accuracy. In adverse weather conditions or when flying is not possible, a similar tracking device mounted on forklifts—combined with GPS—was used to detect nearby assets during normal operations.
Results
The customer now has real-time visibility into the location of his semi-finished products, without requiring workers to perform manual tracking. This streamlined system has significantly improved production efficiency and reduced delays.
About BIT-TONIC
Bit Tonic Srl, based in Turin (Italy), is a Software Solution Provider company specialized in customized cloud, web, mobile and desktop applications and localization systems.
Bit Tonic develops solutions for logistics and warehouse management, worker safety, and building management, also utilizing AMR autonomous guided rovers and drones. Bit Tonic solutions help companies and organizations to manage their processes in order to increase efficiency and offer new services or, in other words, reduce costs and increase revenue.
Bit Tonic provides a turnkey custom solution to satisfy the Customer need starting from localization data and integrating them with the existing Customer applications or ERP. Bit Tonic takes care of the system design, hardware supply, support during the hardware installation, system configuration and testing and maintenance during the entire lifetime.
Bit Tonic is the one-stop shop for all your localization needs.
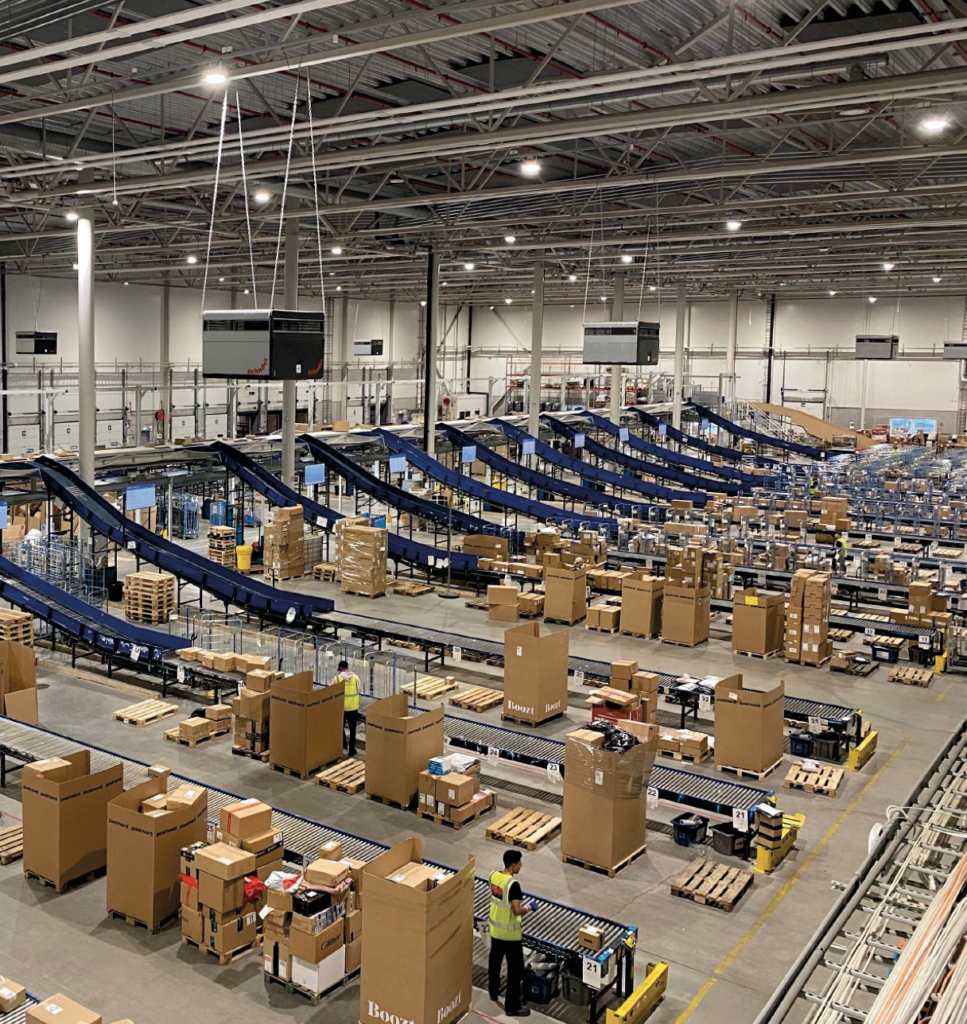
PostNord’s Hakkila terminal in Finland faced challenges in operational efficiency and process visibility—until they introduced a powerful new digital thread solution. By combining Quuppa’s real-time location technology with computer vision and analytics, PostNord gained a 25% boost in sorting efficiency and a 32% increase in parcels handled per hour.
ALL SYSTEMS GO!
Improving operational efficiency in a sorting center is always front of mind for managers, but it can often be challenging. At PostNord’s Hakkila terminal in Finland, for example, management faced challenges when trying to optimize the facility’s sorting processes.
The terminal had problems maintaining operational quality, due to site design, fluctuating volumes and changing management and processes. There was also a lack of oversight of resource use and process compliance, and an inability to measure performance.
“The terminal was fairly new but had become congested quickly due to the volumes coming in,” explains Christian Østergaard, PostNord’s lead visionary and senior group strategist. “They had just gone through their first peak, which management felt had been quite disorganized and inefficient, so they reached out to our team to see how we might help them address issues around productivity, throughput and efficiency.”
The timing couldn’t have been better for Østergaard and his colleagues as they had something new they wanted to trial: a digital thread sorting solution.
We wanted to be able to monitor all our internal processes and to see where our workers were, to see if the processes were optimal
Christian Østergaard, PostNord
When looking to improve operational efficiency, the focus is often on working out which of the many sorter and process flow configurations is optimal for a specific facility. However, what is regularly overlooked is improving visibility across the site – of everything from execution flows and resource allocation through to movements and internal transportation.
Most managers won’t have access to such information, which means decisions are often based on personal experience or a ‘gut feeling’, and will differ from leader to leader. Being in constant operational mode also limits managers’ ability to think about these details, which is why PostNord wanted to trial this new solution, which would introduce more data-driven ways of working and just-in-time thinking.
Digital thread sorting solution
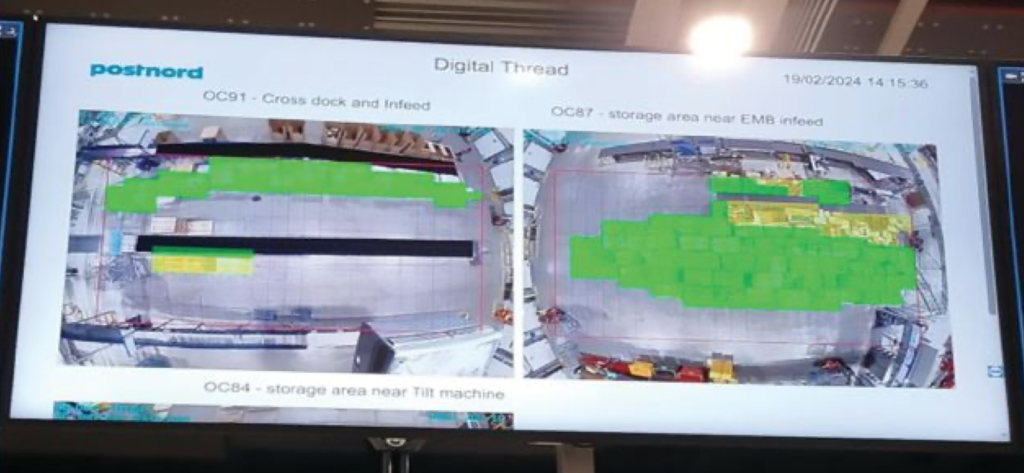
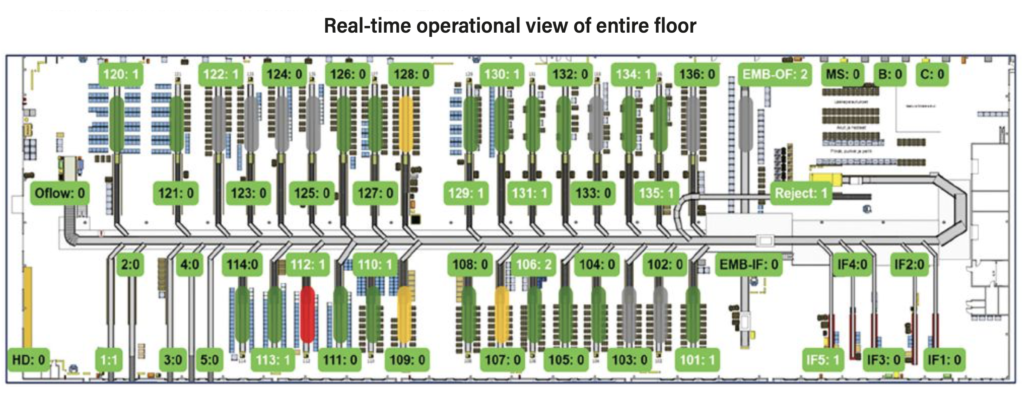
PostNord’s digital thread sorting solution creates a real-time representation of the entire sorting center across all assets and moving parts, thereby improving the understanding of process flows.
LEFT: The digital thread sorting solution uses a real-time location system to ensure workers are in the optimal place.
RIGHT: The solution enables PostNord staff to quickly identify areas of concern within the sorting machines
It is the result of several technology projects across the organization that Østergaard and his colleagues realized could be amalgamated and developed into an overarching sorting solution.
“The idea was to use computer vision together with a real-time location system (RTLS),” Østergaard explains. “Putting sensors in different places across the terminal would enable us to collect data in real time. We wanted to be able to monitor all our internal processes and to see where our workers were, to see if the processes were optimal or whether there was room for improvement.”
Digital thread benefits
An operational efficiency gain of more than 25% in sorting operations
A 32% increase in the number of parcels sorted per hour
Percentage of sorting staff meeting KPIs has risen from 20% to 54%
ROI of technology pilot was less than four months
Gaining trust
The rollout of the digital thread sorting solution took place in stages, working in close collaboration with the local management team.
“When you come in with a new technology, it’s important to gain the trust of the people who will use it. We had a list of the things we wanted to do but began by asking them if they had specific problems that they wanted us to look at,” Østergaard reports.
“They raised two areas of concern: an underperforming machine and making sure the first-in, first-out principle was being used when it came to storage. For the first issue, we were quickly able to establish functions that enabled staff to see what was going wrong in the process, so it could be resolved. For the second, we visualized things for them, so they could see what was happening. This built the trust and it then became a question of okay, how do we go ahead and roll out everything else?”
At each stage of the rollout, solutions were reviewed and tweaked if necessary. “It was a great collaboration, where there was the strategic team looking at how we can get the technology to work, our partner vendors, who were focused on making it work, and the local tech-savvy management, who were keen to use technology to improve efficiencies,” comments Ravi Kiran Kotty, digital transformation technology strategist at PostNord.
“They’d say, ‘Okay, we think we can be more efficient here’, and we’d sit down and come up with a solution. If the first iteration didn’t work exactly as they wanted, then we reconfigured it so that it was fit for their purpose.
“It was a slow evolution,” Kotty continues. “We went use case by use case. Once it was implemented, we would evaluate whether it added value before moving on to the next one. We’d identify an asset, try to generate data from it, then the value, before looking to add additional assets. There was no big bang, it was a progressive thing, which added value exponentially with every use case.”
Everyone likes simplicity. They don’t want a lot of data, just quick answers or simplified guidance.
Ravi Kiran Kotty, PostNord
A collaborative partnership
After launching its new sorting facility in September 2022, PostNord faced challenges with productivity KPIs such as parcel throughput and production efficiency. The need for reliable tracking and monitoring led to the implementation of Quuppa’s RTLS technology. By tracking mobile devices and forklifts, PostNord gained real-time visibility of transportation movements and resource allocation, especially in critical areas like sorting machines and cross-docking zones. This visibility allowed for the identification of process inefficiencies, enabling optimization of workflows.
The collected KPIs and analytics are computed in near real time and provided directly to the relevant people within the facility, allowing PostNord to optimize work floor and sorting chute handling, monitor the number of trips between overflow chutes and improve the use of the cross-docking areas. These improvements have resulted in a more than 20% increase in efficiency and productivity.
The technology also enables data-driven decision-making, moving away from guesswork to fact-based planning. Real-time insights allowed better resource allocation and shift planning, improving operational processes and reducing internal lead times. This shift has helped PostNord to achieve higher delivery quality and improve parcel throughput.
By integrating the system into a digital twin model, PostNord has advanced toward its 2032 vision of touchless parcel handling, improving both operational efficiency and sustainability.
PostNord partnered with two key vendors on the development of the digital thread solution: Tata Consultancy Services (TCS) and Quuppa. TCS helped the post build its computer vision models, while Finnish startup Quuppa provided high-precision indoor tracking technology.
Work on the project began back in May 2023, with the digital thread solution completed by the end of January 2024. The biggest integration of new technology into the terminal was the installation of Quuppa’s RTLS technology. This entailed a full site survey to assess what was needed in terms of physical infrastructure.
“The first part was installation, which took some time, but after that we were able to deliver new use cases every couple of weeks,” Kotty notes.
ABOVE: The solution provides a real-time overview of parcel volumes.
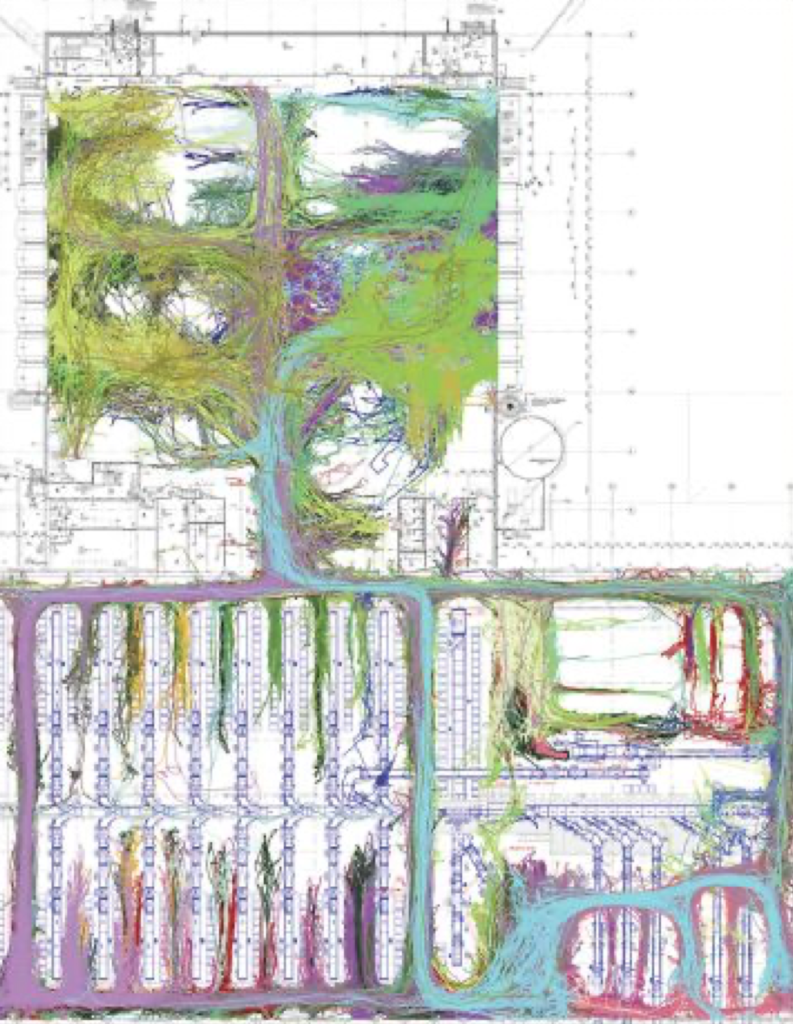
LEFT: A spaghetti diagram of internal transportation volume in the sorting terminal.
One of the first use cases was employing PostNord’s existing security camera system to monitor movements and processes, to identify areas of concern. “The good thing with computer vision is that if you already have the cameras, you just need to introduce an ‘intelligent filter’ that is trained in what to identify and measure,” says Østergaard.
Improving visibility
PostNord says the digital thread is helping to measure two key areas: productivity and internal transportation. Productivity is assessed in an anonymized way, examining processes and supporting functions using existing handheld devices.
“We don’t want to know who each worker is – we simply want to know where people are and what they are doing at any given time. We ‘Smurf’ them, because our system shows them as blue,” Østergaard chuckles.
This enables management to see whether the site or workflow is designed in a way that adds leakage. They can also evaluate different processes and identify any wasted productivity and the reason behind it.
In terms of internal transportation, visualization, control points, flow optimization and new data help PostNord achieve better use of assets like forklifts, employees and floor space.
Benefits to all
The digital thread benefits all levels of staff, from those on the shop floor through to shift leaders and process designers. The business case has already been proved at Hakkila, where the terminal has seen a more than 25% increase in operational efficiency in sorting, in addition to increased productivity, improved quality, the removal of bottlenecks and the establishment of performance measurement.
“We regularly check in with the Hakkila team and each time we speak they’ve consistently improved,” enthuses Kotty.
“That’s possible because we’ve created a ‘blue ocean’ of data; some that had never been looked at before,” Østergaard adds.
A standout use case at Hakkila has been the introduction of a simple traffic light system to communicate needs to terminal staff. PostNord has a staff turnover of 8% a month in this specific terminal, so it needed something straightforward and self-explanatory that everyone could understand straight away. It therefore introduced a visual tool where screens show areas of the facility as green (low attention), yellow (high attention) or red (critical) to let staff easily see where they’re needed. “If they see a red or yellow area on the screen, they know they can be useful there. This visualization enables them to make better use of themselves without the need for management to intervene,” continues Østergaard.
By giving staff continuous information on where they were most needed, the number of parcels they could handle per hour increased by almost 30%, notes Kotty. In addition, before the introduction of the traffic light tool, only 20% of those on the floor were able to meet the KPI targets PostNord had set – now 54% can. “They’re able to work more efficiently,” he enthuses.
ABOVE: A traffic light visual tool ensures the system is easy for new staff to understand
Modern image
The introduction of the digital thread has had a positive impact on the company’s image, with many employees saying that they regard PostNord as a modern employer.
“Many of our employees are gamers; they have a vacuum cleaner robot at home; they’re tech savvy and have an expectation that their employer will be too.
So it’s been very positive for the company’s brand,” explains Østergaard. “It’s also easier to teach people new functions.”
“Indeed, we always want to trust simplicity rules, and this project helped us validate that,” notes Kotty. “Everyone likes simplicity. They don’t want a lot of data, just quick answers or simplified guidance.
“The ROI is between three and four months, again validating this as a good approach to take. Of course, there are a couple of prerequisites: you need an organization that’s tech savvy, and people who are open to change and will support your implementation. But there are not many use cases where you can see productivity increases of this ratio, with this kind of payback.”
What lessons has POSTNORD learned?
Tech-savvy local management and workers are key to implementing and adopting new technology in operations
You can make use of lots of your existing infrastructure to gain new insights into how your processes are running
Collaboration between all parties is essential
Keep communication of data simple and straightforward
Next steps
Next steps The development of the digital thread is an important step toward hyper-automation of PostNord’s terminal operating execution model. The post says it’s been a perfect playing field for operations, innovation and IT to evaluate and implement the right changes and at the right time.
It plans to continue bringing many of its use cases together as part of the digital thread, including asset tracking, forecasting and digital twins.
Based on the success at Hakkila, PostNord is now rolling out the digital thread solution in Denmark. Once the first site has been successfully completed, the plan is to scale it to the country’s two largest terminals.
PostNord is the leading provider of parcel and logistics services in the Nordic region. Formed through the merger of Sweden’s Posten AB and Denmark’s Post Danmark, PostNord delivers efficient, reliable, and sustainable logistics solutions to businesses and individuals across the Nordics and beyond. With a strong focus on digital transformation, innovation, and customer satisfaction, PostNord plays a key role in enabling the flow of goods and communication in an increasingly connected world.
Get Latest Updates On Location Technologies!👇
Manage Cookie Consent
We use technologies like cookies to store and/or access device information. We do this to improve your browsing experience. Consenting to these technologies will allow us to process data such as browsing behavior or unique IDs on this site. Not consenting or withdrawing consent may adversely affect certain features and functions.
Functional
Always active
The technical storage or access is strictly necessary for the legitimate purpose of enabling the use of a specific service explicitly requested by the subscriber or user, or for the sole purpose of carrying out the transmission of a communication over an electronic communications network.
Preferences
The technical storage or access is necessary for the legitimate purpose of storing preferences that are not requested by the subscriber or user.
Statistics
The technical storage or access that is used exclusively for statistical purposes.The technical storage or access that is used exclusively for anonymous statistical purposes. Without a subpoena, voluntary compliance on the part of your Internet Service Provider, or additional records from a third party, information stored or retrieved for this purpose alone cannot usually be used to identify you.
Marketing
The technical storage or access is required to create user profiles to send advertising, or to track the user on a website or across several websites for similar marketing purposes.